Ecodriving scores each vehicle and each driver 0–100 from the violations your Wialon account already records, and keeps the individual events behind the score in a table and on a map. The criteria, thresholds and penalty weights are the ones configured on your units, so any score can be traced back to the events that produced it.
Drivers dispute numbers. Every score here opens into the weighted violations that produced it, and every violation into its start point, end point, duration and maximum speed.
Distance is the wrong yardstick for some fleets
Ranking on raw violation counts penalises whoever drives most, so counts are normalised by exposure. Distance works for long-haul and understates exposure for city work and machines, so the metric is a setting: per kilometre, or per unit of driving time.
The criteria are the ones already in your account
Harsh acceleration, harsh braking, sharp turns, speeding, sensor violations, harsh driving and excessive idling are read from each unit's Wialon configuration, under your names and in your language. Rename a criterion in Wialon and the column here renames itself. A unit with no criteria configured is skipped rather than scored.
Who it is for
Fleet and safety managers who need a driver ranking they can defend, where any score opens into the events behind it.
Wialon partners who want driver scoring to sell without building the scoring model, the map layer and the export pipeline themselves.
What you get
0–100 driving score
Weighted violations divided by exposure, expressed out of 100. Colour-banded into Excellent, Good, Average and Poor on thresholds you set.
Vehicles and drivers
The same report grouped either way. Both rankings come from one model, so they agree with each other.
Violations on the map
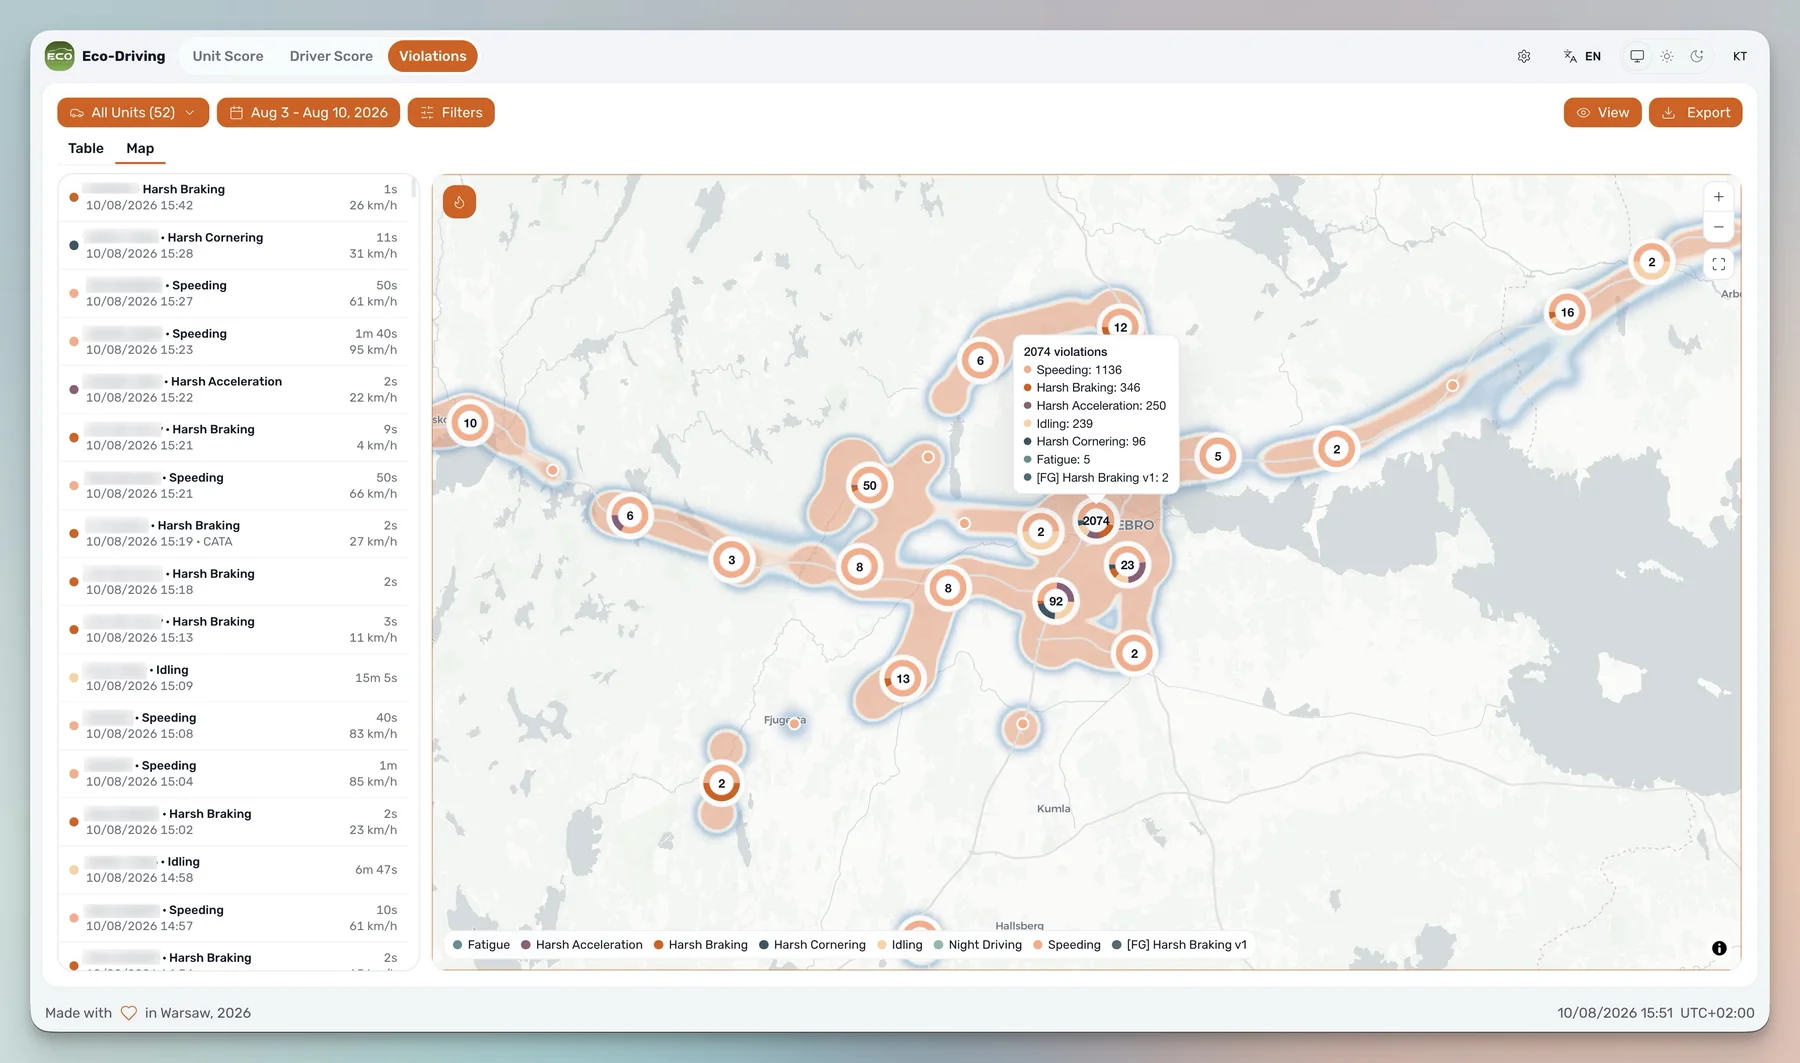
Clusters drawn as pie charts split by criterion, a heatmap tracing the start-to-end path of each event, and per-event focus with A and B markers.
Tunable scoring
Metric, penalty multiplier and score bands are settings. If every vehicle lands in one band, lower the multiplier and the scores spread out.
A month of events at once
The violations table is virtualised, so fleet-wide events over a full month scroll without slowing down.
Export what is on screen
Excel, CSV and PDF, respecting the active filters, unit selection and date range. The Excel output includes start and end coordinates.
The data itself
Unit Score
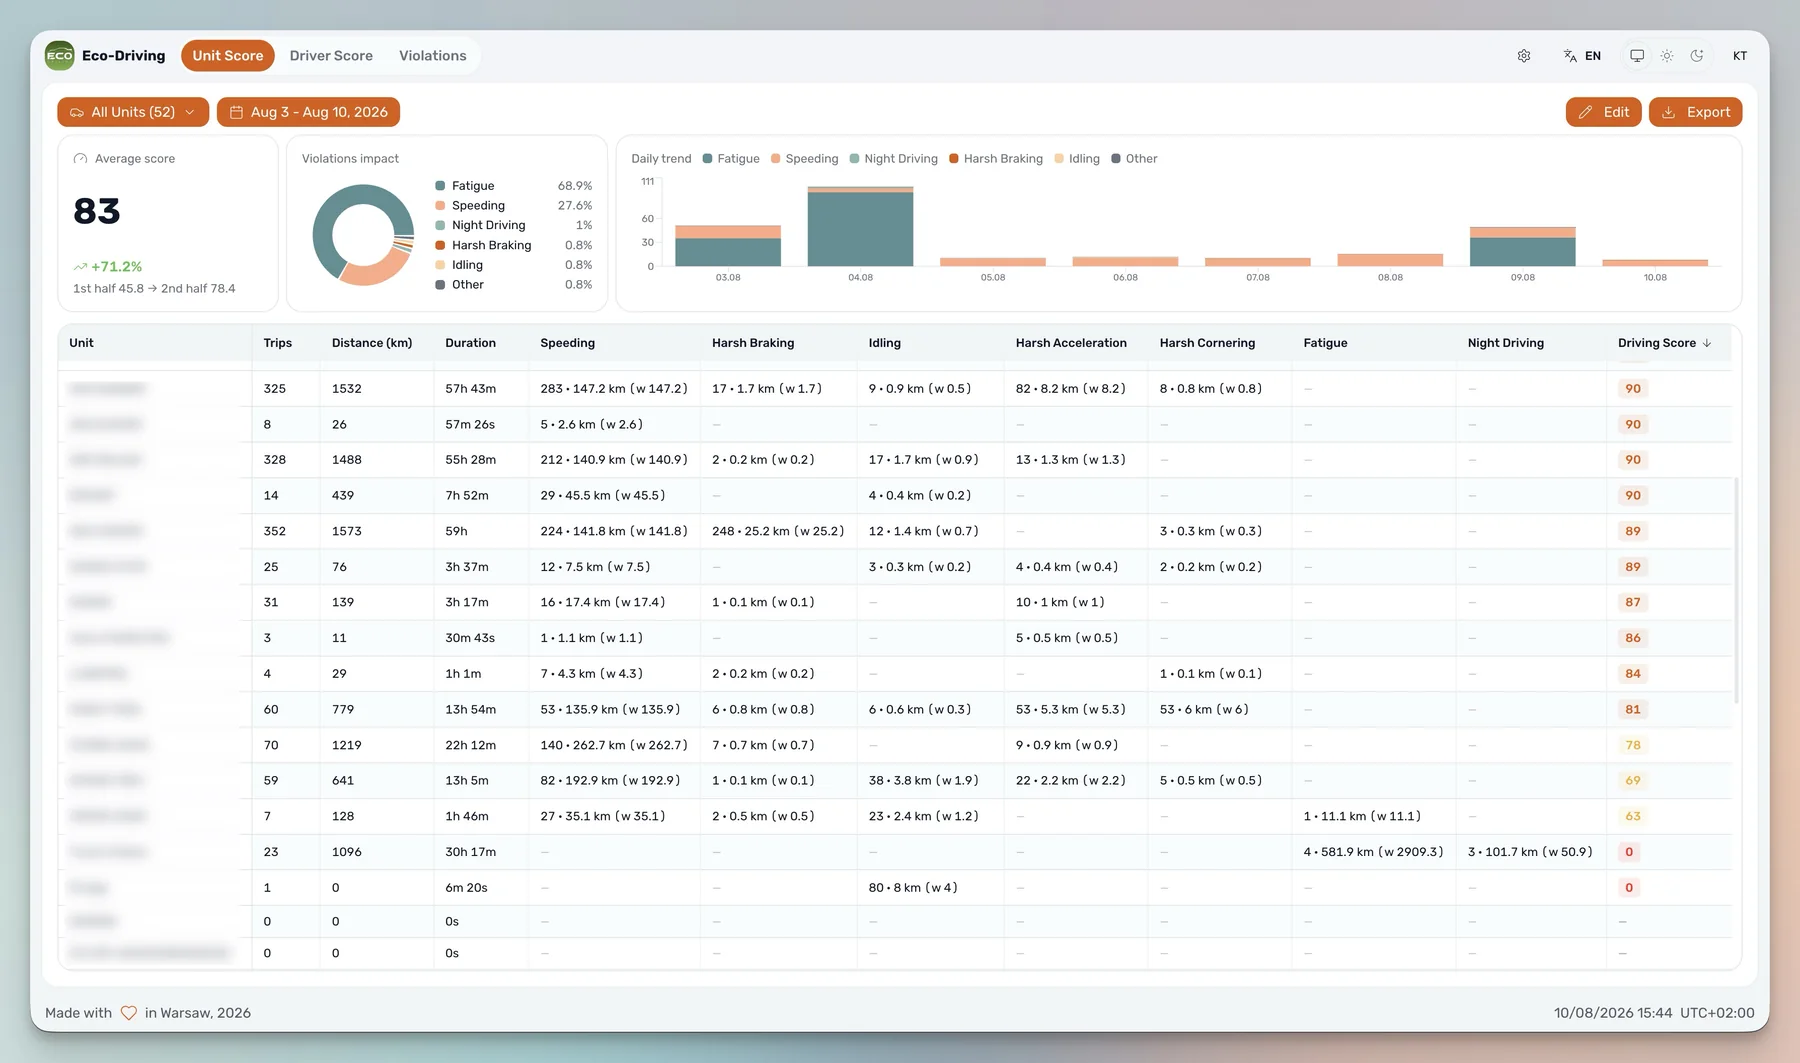
One row per vehicle: trips, distance, duration, a column per criterion, and the score as a badge. Each criterion cell shows count, raw amount and the weighted value applied.
Driver Score
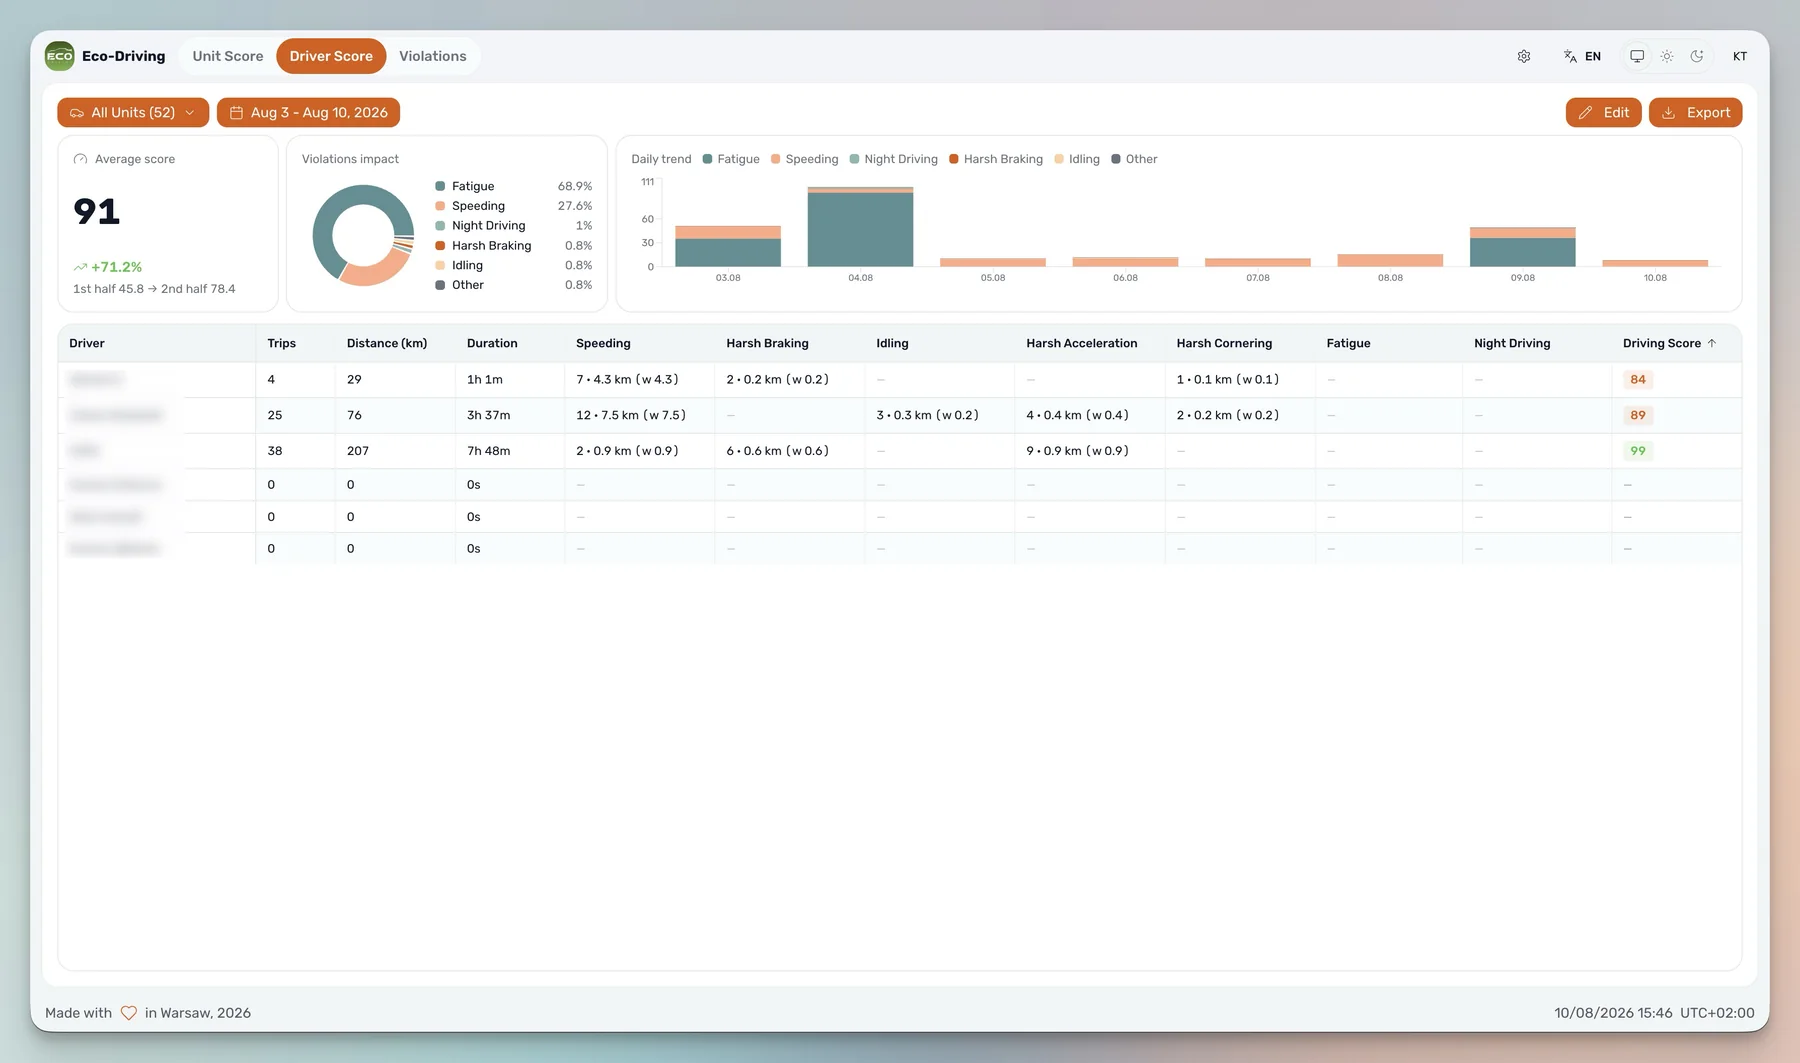
The same report grouped by driver, using the driver bound to the unit at the time of the event rather than at the time of the report.
Violations
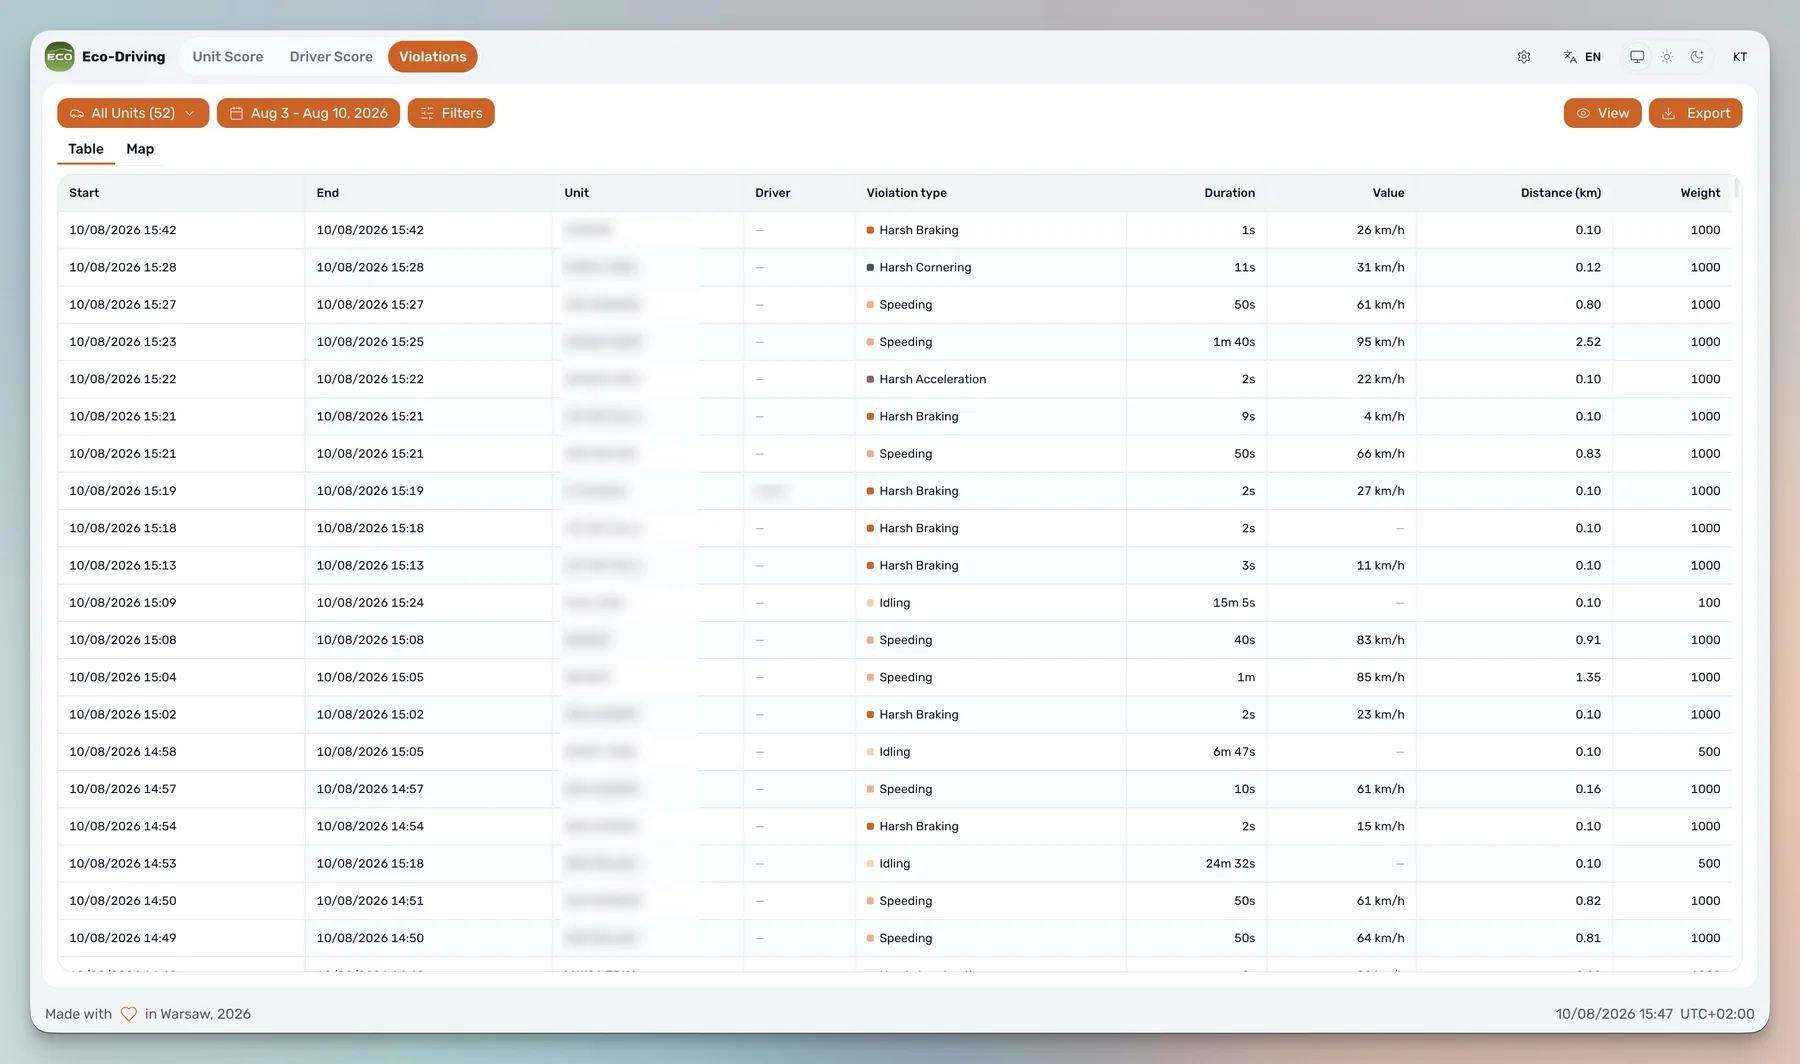
Every event with start, end, unit, driver, criterion, duration, maximum speed, distance and weight. Filterable by driver, type and minimum value.
How to get started
There is no Ecodriving account to create. Either sign in against your Wialon server, or register Ecodriving as an application in the CMS so it opens from Wialon already authenticated.
Active SID · Host URL · Current user · Base URL · Authorize hash
How it connects
1
Step 1: Your units appear
The criteria already configured on your units are read as they are. There is nothing to set up here before the first report.
2
Step 2: Pick units and a period
Choose individual units or groups and a date range. With nothing selected, every unit is included.
3
Step 3: Read the ranking
Average score with a first-half against second-half trend, a donut of which criteria cost the most points, and a daily bar of points lost per criterion.
4
Step 4: Open the events behind it
Switch to Violations to see the individual events as a table or on the map, filtered down to the driver, criterion or severity in question.
White-label
Ecodriving ships white-label: partners deploy it under their own brand and domain.
Your brand and your domain; the customer sees your product rather than ours.
Reads the customer's own Wialon criteria, so the scoring reflects their policy rather than ours.
You hold the commercial relationship and the billing.
Scoring model, map layer and export pipeline are maintained on our side.
Security and access
Sign-in goes through Wialon's own login page. There is no separate account and no password stored here.
Everything is read live from the Wialon Remote API. There is no second copy of the fleet.
Access is revocable from Wialon at any time.
Scoring criteria and weights stay in Wialon, so the customer keeps control of the policy being applied.
From your Wialon units. Ecodriving reads the criteria configured there, including thresholds and penalty weights, rather than defining its own. The report therefore reflects the policy your organisation already agreed, and renaming a criterion in Wialon renames the column in the report.
How is the score calculated?
Each violation is multiplied by the penalty weight of its criterion, the weighted violations are summed, and the total is divided by how much the unit drove, so covering more ground is not itself a penalty. The result is expressed out of 100, where 100 means no weighted violations. You choose whether exposure is measured by distance or by driving time.
Every vehicle is in the same band. Is the report wrong?
Usually the Wialon penalty weights are large relative to your fleet, which compresses the range. Lower the penalty multiplier in the settings, to ×0.1 or ×0.01, and the scores spread out. The ranking between vehicles does not change, only the scale.
What happens to units with no eco-driving data?
A unit with no criteria configured produces no violations and no score, and is skipped rather than shown as a perfect 100. Units with no distance or driving time in the period are sorted to the bottom instead of scored.
Some of our events have no coordinates. Does the map still work?
Some Wialon accounts do not include positions in eco-driving data. The map reports how many events could not be placed instead of rendering empty. The table and the scores are unaffected.
Can we sell it under our own brand?
Yes, under your brand and domain. The criteria and weights stay in the customer's Wialon account, so the policy being applied is theirs and the commercial relationship is yours.
Ecodriving is live on the Wialon Marketplace: 0–100 vehicle and driver scores from your own Wialon criteria, violations on a map, export to Excel, CSV, PDF.
Fleet Configuration Tools is live on the Wialon Marketplace: rename or delete a sensor across every unit, and set each odometer from its mileage sensor.